EN
The carbon footprint of transportation fuels is weighing heavily on energy policy, agricultural strategy, and corporate sustainability commitments. When comparing bioethanol vs fossil fuel carbon emissions, most assessments stop at tailpipe CO₂ or land-use change, and treat the plant itself as a black box. In my work designing integrated ethanol production systems that capture waste heat, convert biogas into process energy, and turn co-products like DDGS and CO₂ into commercial streams, I have seen the real environmental balance pivot on how the facility is configured. A well-integrated plant can push life‑cycle carbon reduction well past the averages that appear in public studies. This article breaks down the carbon numbers, then walks through the plant‑level engineering choices that separate a marginal gain from a deep, verifiable cut.
Every gallon of gasoline burned releases roughly 8.9 kilograms of CO₂, and upstream extraction, refining, and transport add another 2‑3 kg. Corn ethanol, on the other hand, absorbs CO₂ during crop growth. Standard life‑cycle models such as GREET from Argonne National Laboratory show that average U.S. corn ethanol reduces greenhouse gas intensity by 40‑52% compared to gasoline, depending on the plant’s energy source and co‑product crediting. When a facility runs on natural gas and sells dried distillers grains as animal feed, the carbon intensity sits near the middle of that range; when it substitutes biogas from wastewater treatment for a portion of its thermal load, the figure can reach a 55‑60% reduction.
The difference between a 40% and a 60% cut is entirely a function of process integration, not of the fuel molecule itself. That integration is rarely unpacked in public‑facing comparisons, and it is the variable that procurement teams and policy makers need to understand if they are basing decisions on carbon metrics.
Carbon accounting for ethanol follows a well‑to‑wheel model: feedstock production, fertilizer manufacture, transport, fermentation, distillation, dehydration, fuel distribution, and combustion. Each step contributes, but three steps dominate the balance.
First, the energy used in distillation. A conventional six‑column distillation and molecular sieve dehydration unit can consume 25‑35% of a plant’s total energy input. Second, nitrogen fertilizer applied to corn accounts for about 18‑22% of the total life‑cycle carbon, because its manufacture is energy‑intensive and soil emissions add nitrous oxide, a potent greenhouse gas. Third, co‑product allocation: when the plant sells DDGS, corn oil, and captured CO₂, a share of the upstream carbon burden is assigned to those products, lowering the ethanol‑only footprint.
If these three levers are managed well, the net carbon result moves decisively in ethanol’s favor. If any one is ignored, the advantage shrinks. For a plant buyer evaluating a turn-key project, the technical questions around these three areas are the ones worth asking before a single piece of equipment is ordered.
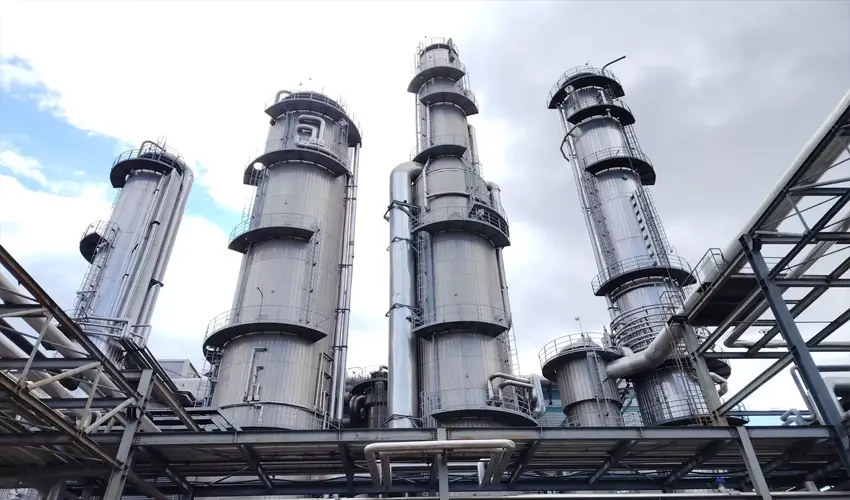
This is the point where most comparisons stop, and where the real carbon advantage is built or lost. Modern ethanol facilities that are designed as a circular system rather than a straight line can shift their energy balance in ways that are not captured by generic life‑cycle data.
Energy cascade utilization, for example, recovers heat from distillation columns and uses it to pre‑heat incoming slurry, reducing steam demand by roughly 12‑18%. Biogas from anaerobic digestion of thin stillage and other organic waste streams can replace 20‑30% of the natural gas a plant would otherwise burn, cutting scope‑1 emissions directly. In the systems I have evaluated, these two measures together lowered the plant’s thermal‑to‑ethanol ratio from a baseline of around 25 MJ/L to below 18 MJ/L, which translates into a carbon intensity reduction of about 15 g CO₂e per megajoule of ethanol.
Capturing fermentation CO₂ for food‑grade sale removes a direct emission from the facility while creating a revenue stream that further improves the economics. And closing the water loop through anaerobic‑aerobic treatment and reverse osmosis not only meets tightening discharge permits but avoids the embedded carbon of freshwater supply. Taken together, these integration steps turn the ethanol plant into an energy‑positive node in the industrial food‑energy‑feed network rather than a net consumer.
| Integration Measure | Typical Carbon Impact | Implementation Complexity |
|---|---|---|
| Energy cascade (heat recovery) | 8‑12% plant‑wide energy saving | Medium |
| Biogas from thin stillage | 20‑30% fossil fuel displacement | Medium‑high |
| CO₂ capture & purification | Avoids 1.0‑1.2 kg CO₂/L ethanol | Medium |
| Closed‑loop water treatment | Cuts embedded carbon from water supply | Low‑medium |
| Combined product‑stream valorization | Shared carbon burden across co‑products | Design phase dependent |
For organizations that are committing capital to a new fuel ethanol line, the design choices reflected in this table are not optional extras; they determine whether the resulting carbon intensity qualifies the fuel for premium low‑carbon fuel standards or falls short. If your project involves a location where grid electricity is coal‑based, the biogas and heat recovery measures move from “beneficial” to “essential” for achieving a believable carbon reduction claim.
No honest assessment of corn ethanol can ignore the land‑use question. Direct land‑use change from converting grassland to corn cultivation can release soil carbon that takes decades to repay. However, current U.S. corn acreage has been relatively stable, and yield improvements since 2010 have supplied the ethanol industry without net expansion onto new land. The indirect land‑use change modeling remains contested, but even in the most conservative assessments, ethanol produced with best‑practice farming and plant integration still shows a net carbon advantage.
The co‑product system also shifts the sustainability calculus beyond carbon alone. A 50‑million‑gallon ethanol plant generates roughly 150,000 metric tons of DDGS annually, which displaces soybean meal and corn in livestock rations, reducing the land area needed to produce equivalent feed protein. When this displacement is credited, the land‑use efficiency of the combined corn‑ethanol‑livestock system improves measurably, something that single‑issue carbon accounting often misses.
I have worked with agricultural clients who initially viewed ethanol only as a fuel play and later realized that the feed, biogas, and CO₂ streams were the real long‑term value anchors. The environmental story runs parallel to the economic one: a system that recovers every major mass and energy stream will deliver a lower carbon footprint, year after year, than one that treats any stream as waste.
Bioethanol production does not exist in isolation from the agricultural economy that feeds it. When an ethanol plant is designed as part of a corn‑deep‑processing cluster that also includes starch, glucose syrup, or modified starch lines, the shared infrastructure (grain receiving, cleaning, water treatment, power) lowers the carbon burden per unit of output across all products. The industrial park model we apply in several grain‑processing projects uses a single steam and power island to serve multiple downstream plants, improving energy efficiency at the cluster level by roughly 15% compared to standalone operations.
This systems perspective matters because the carbon regulation landscape is moving toward supply‑chain‑level accounting. A fuel buyer who needs to demonstrate scope‑3 reductions will scrutinize not only the ethanol plant’s direct emissions but also the upstream grain handling, the nitrogen management on the farm, and the end‑use disposal of co‑products. A facility designed from the start to tighten links across the chain—grain storage with thermal‑insulated silos that lower drying energy, integrated feed‑lot proximity that cuts DDGS transport miles—will outperform a retrofit that addresses carbon one process unit at a time.
For organizations evaluating a new ethanol project or upgrading an existing one, the operational requirements that actually deliver verified carbon savings need to be spelled out during the front‑end engineering phase. A feasibility study that models the specific integration options for the feedstock, water availability, and energy mix of the site will produce a much more reliable carbon forecast than any generic industry benchmark. If your team is assembling a business case that depends on a specific carbon intensity target, the plant‑level variables described here are where the real sensitivity lies. Contact our engineering group at bjhn@agrifamgroup.com or call 010‑8591 2286 to discuss how facility configuration affects the sustainability metrics that your project needs to meet.
It reduces total greenhouse gas emissions on a full life‑cycle basis, but only when the plant captures co‑product credits and uses efficient process energy. Corn ethanol that relies solely on coal‑fired electricity and sells wet distillers grains locally still shows a net reduction compared to gasoline, but the margin is smaller. The reduction is real and measurable, not a transfer, because biogenic CO₂ from fermentation and combustion is offset by the carbon absorbed during corn growth, while every kilogram of fossil CO₂ released adds new carbon to the atmosphere.
DDGS, corn oil, and captured CO₂ each receive an allocation of the upstream carbon burden, which lowers the carbon intensity assigned to ethanol itself. The exact allocation method (mass‑based, energy‑based, or market‑value‑based) affects the final number. In practice, the more co‑products a plant monetizes and the higher their market value, the lower the carbon intensity of the ethanol. This is not an accounting trick; it reflects the fact that the same corn kernel yields multiple useful outputs, and the environmental cost should be shared among them.
The net energy ratio—the energy contained in the ethanol divided by the fossil energy used to produce it—now ranges between 2.0 and 2.8 for modern dry‑mill plants, according to USDA surveys. Ratios above 2.0 mean ethanol returns more than twice the fossil energy invested. This matters for sustainability because a ratio below 1.0 would make ethanol a net energy drain; today’s mid‑western plants are clearly energy‑positive, and integration measures can push the ratio toward 3.0, further strengthening the carbon case.
Yes, but it works better as part of a system than as a standalone fuel mandate. When an ethanol plant is co‑located with livestock operations, the DDGS reduces the land needed for feed, the biogas displaces gas for power or heat, and the captured CO₂ can be used in greenhouse horticulture or food processing. In this arrangement, the carbon reduction spreads across three sectors—transport, agriculture, and food—creating a larger net benefit than any single‑sector metric would capture. For farmers and agribusiness groups, this multi‑sector impact often aligns with the broader sustainability commitments they are already making.
Three design features matter most: a thermal integration plan that recovers at least 15% of distillation heat, a biogas system sized to displace a significant share of the plant’s fossil fuel consumption, and a co‑product handling strategy that maximizes the value of DDGS, corn oil, and CO₂. Site‑specific factors such as grid carbon intensity, water availability, and the local market for feed and CO₂ will determine which measures are cost‑effective. A front‑end engineering study that models these variables against the project’s target carbon intensity score will provide the most reliable investment guidance. Share your feedstock, site conditions, and carbon target with our team at bjhn@agrifamgroup.com to receive a tailored assessment of how plant configuration affects the environmental metrics that drive fuel‑standard eligibility.
If you’re interested, check out these related articles:
Driving Global Food Conservation Through Technological Innovation







bjhn@agrifamgroup.com