EN
Converting corn into ethanol is a mature industrial process, but the actual conversion rate—the volume of anhydrous ethanol produced from a bushel of corn—varies far more in practice than laboratory summaries suggest. A well-integrated plant does not simply extract starch; it orchestrates raw material quality, enzyme kinetics, fermentation efficiency, and energy reuse as a single continuous system. From our work engineering complete alcohol production lines, I have observed that the gap between a theoretical 2.85 gallons per bushel and a real-world 2.70 gallons per bushel is rarely caused by a single bottleneck. It accumulates across dozens of small losses that most audit reports gloss over. This article walks through the factors that collectively determine the corn-to-ethanol conversion rate in a turnkey plant environment, including grain handling, process control, by-product integration, and the circular economy model that turns waste into revenue without sacrificing core yield.
Every percentage point of starch lost before fermentation is ethanol that never gets produced. Corn arriving at the intake pit is not a uniform raw material—it is a biological variable with moisture, test weight, and foreign matter that shift daily. I have seen plants operate for months without correcting their cleaning line after a change in corn origin, losing 0.3% to 0.5% of starch through screenings that were never sent to the mash preparation step.
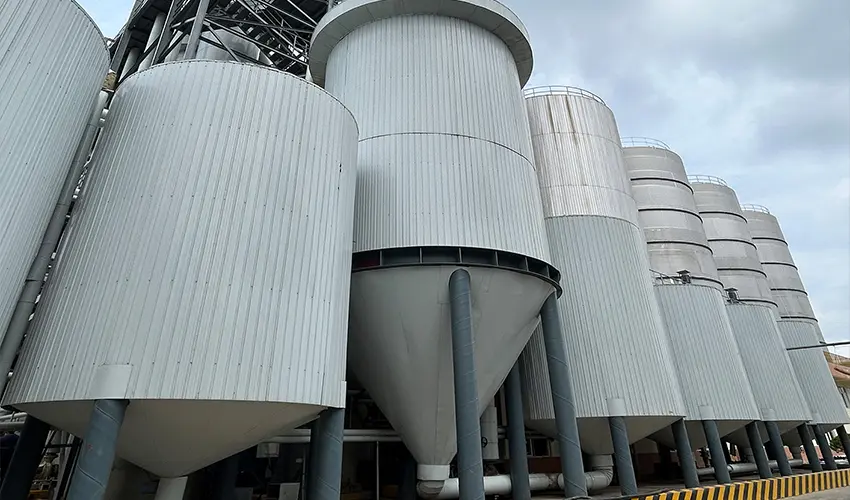
The purification sequence—rotary screens, magnetic separators, aspiration channels—must be configured for the specific corn profile, not left on a generic setting. Broken kernels and fines that bypass the soak phase create downstream viscosity problems in liquefaction, and foreign material like cob fragments and stones not only reduce net starch entering the system but accelerate wear on hammer mills. Regular sampling at the post-cleaning weigh point lets plant operators correlate variable corn quality with real solvent yield. When we audit a line, the first number we check is the starch accountability across cleaning: what percent of theoretical starch arrived in the grinding step. If that gap exceeds 0.2%, no amount of enzyme optimization downstream will fully recover the shortfall.
Milling, liquefaction, and saccharification together determine how much of the endosperm starch becomes fermentable glucose—and how much ends up as unfermentable dextrins that exit the plant in DDGS. The conversion rate ceiling is set at this stage.
Hammer mill screens govern surface area for hydration and enzyme access. A 3.2 mm screen works for many dry-grind plants, but when the plant uses hard endosperm corn or operates at higher solids loading (above 32%), we spec a 2.8 mm screen. The trade-off is mill throughput, but under-sized grist raises peak viscosity during liquefaction and forces a higher alpha-amylase dose to avoid starch retrogradation. The conversion rate penalty from coarse grist is measurable: a 0.5 mm increase in average particle size can shift 0.3–0.5% of starch from the fermentable pool to the residual starch fraction in DDGS.
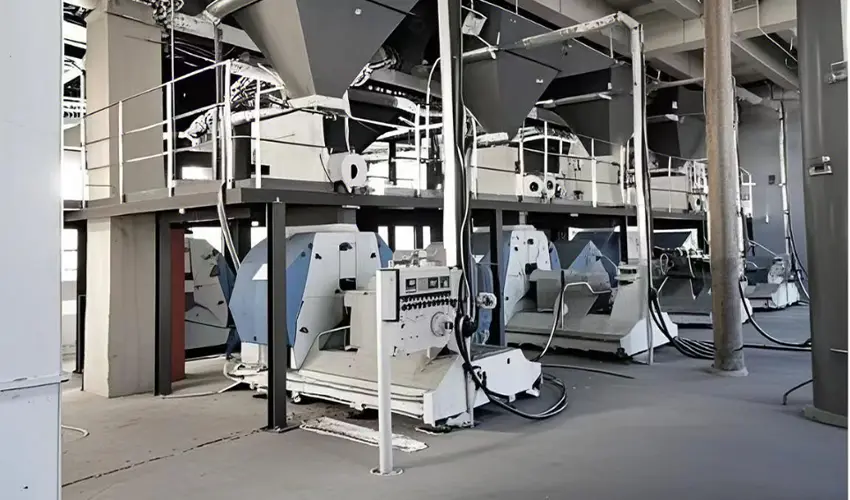
Thermostable alpha-amylase dosage is typically set by the supplier’s initial recommendation, but real plant performance requires ongoing adjustment against jet-cooker temperature profile and mash residence time distribution. A steep temperature gradient from 85°C to 105°C within the jet cooker improves gelatinization but shortens the effective enzyme half-life, so the plant must re-balance. I have seen liquefaction pH drift downward by 0.3 units over eight weeks without the operations team noticing, causing a 1.2% drop in saccharification dextrose equivalent (DE). That alone cost the plant 0.04–0.06 gallons per bushel—and pH drift is one of the cheapest yield losses to fix.
After liquefaction, the glucoamylase pullulanase blend determines how much starch leaves the saccharification tank as true fermentable sugars. A DE target of 94–96% is achievable with a well-insulated saccharification train that avoids temperature drops below 58°C, where pullulanase activity slows sharply. The plant we supported in Qiqihar, Heilongjiang, maintained DE above 95.5% by installing a plate heat exchanger loop that kept the saccharification temperature within ±1.5°C across all tanks, even during winter startup. That stability showed up directly in the alcohol titre and the residual starch level exiting fermentation.
Fermentation is often called the biological engine of the plant, but in a continuous fermentation system it acts more like a biochemical throttle. The conversion rate flows through the yeast population, and small stressors compound across dozens of generations.
Dry-grind ethanol plants operating with 32–35% solids loading challenge the yeast with high osmotic pressure and rising ethanol concentrations. When the final ethanol titre reaches 15% v/v, the yeast’s viability begins to decline; above 16% v/v, fermentation rates drop and glucose accumulations appear in later fermentor stages, reducing the effective ethanol yield by leaving sugars unfermented. I recommend a titre ceiling of 14.5–15.5% v/v for continuous systems, which typically delivers a starch-to-ethanol conversion efficiency of 91–93% without excessive yeast stress.
Propagation protocol also matters. Plants that maintain a dedicated propagation vessel with 6–8% sugar concentration and controlled aeration produce a yeast cream that enters the first fermentor in exponential growth phase, shortening the lag time by 2–4 hours. That earlier onset of active fermentation means more glucose is consumed before the fermentor moves to a lower temperature zone, where uptake rates slow. In a five-stage cascade, the difference between a 4-hour lag and a 2-hour lag shows up as a 0.5–1.0 g/L residual glucose differential at the last stage—direct ethanol left on the table.
If your plant runs a batch fermentation protocol, the same principles apply but the management lever shifts toward fill timing and yeast recycle health. Pitching rates below 3% v/v slow the entire curve; above 5% v/v, ethanol inhibition in the final phase reduces overall efficiency. We see the best batch conversion rates when the temperature profile starts at 32°C and is allowed to rise gradually to 34–35°C over the first 12 hours, then held until completion, rather than a fixed 33°C profile that under-performs in both the growth and production phases.
Distillation does not create ethanol—it recovers it. Losses in this section come from ethanol slip in the stillage, product venting, and incomplete dehydration, and each one directly reduces the net ethanol volume recorded at the plant gate. A plant that ferments 14.8% v/v ethanol but loses 0.4–0.5% v/v in the whole stillage bottoms because of suboptimal tray hydraulics or foaming events is effectively discarding yield that cost the same corn to produce.
AGRIFAM’s alcohol plants configure a multi-column distillation train with differential pressure control to maximize ethanol recovery while minimizing steam consumption. The rectification column typically operates at 1.5–2.0 bar to raise the boiling point of water and reduce reflux ratio, while the stripping column runs at near-atmospheric pressure. This pressure cascade allows thermal integration between the columns and cuts the steam load by roughly 18–20% compared to a single-pressure design—and every ton of steam saved is energy that did not consume corn indirectly by raising the plant’s carbon intensity.
Molecular sieve dehydration using pressure swing adsorption (PSA) works reliably as long as the vapor feed from the rectification column is above 92% ethanol by weight and the regeneration cycle timing matches the sieve bed’s actual water capacity. When regeneration cycle times are extended—often to squeeze production during a high-demand period—the sieve beds start leaking moisture into the product stream, and the anhydrous ethanol specification drifts. Operators correct by increasing reflux ratio in the rectification column, which raises feed concentration but increases steam consumption. The net effect: a conversion rate that looks steady on the daily production report but hides a rising energy bill that undercuts the plant’s true efficiency. We always recommend installing an online moisture analyzer after the dehydrators and auditing the cycle time against bed capacity every quarter.
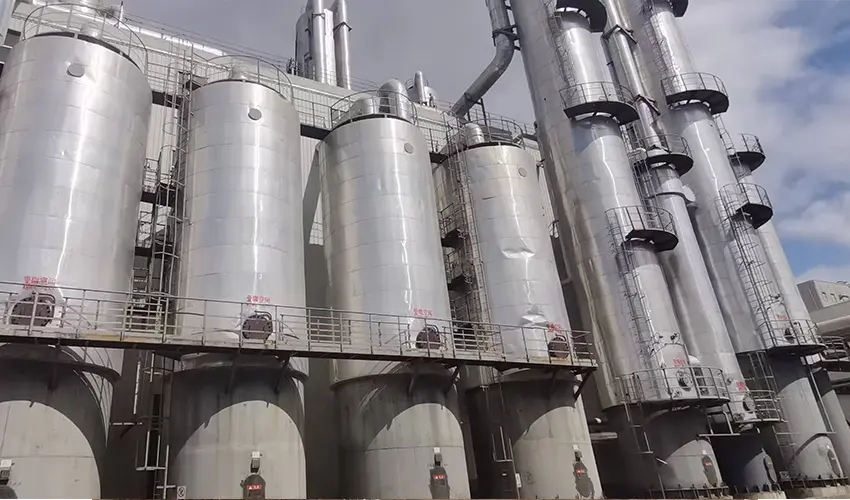
Automated CIP (clean-in-place) systems across the distillation columns prevent fouling that raises pressure drop and reduces mass transfer efficiency. Even a 15% increase in tray pressure drop from scale accumulation reduces ethanol recovery by 0.2–0.3 percentage points. Scheduling a CIP wash every 45–60 days based on pressure drop monitoring, rather than a fixed calendar, has kept column efficiency within design specifications across multiple plants we have commissioned.
A narrow focus on starch-to-ethanol conversion rate misses half the plant’s economics. The real yardstick is the total value extracted from every bushel of corn—and when the plant converts by-product streams into revenue, the effective conversion rate shifts from a process metric into a business performance indicator.
DDGS represents the largest co-product stream, and its quality directly affects the plant’s net corn cost per gallon of ethanol. Low-oil DDGS typically commands a lower price and may signal that the upstream grinding and liquefaction left too much starch bound in the fiber fraction. A 1% increase in residual starch in DDGS translates to roughly 1–1.5% less starch available for fermentation—a direct conversion rate penalty. We monitor the crude protein and neutral detergent fiber levels in DDGS monthly; when the protein falls below 26% (dry basis) in a plant that does not extract corn oil, the starch recovery balance should be reviewed because unconverted starch is diluting the protein percentage.
Liquid CO₂ recovery from fermentation off-gas adds a revenue stream that offsets energy costs and effectively increases the total value per bushel by 5–8%, depending on local food-grade CO₂ pricing. The capture system—usually a low-pressure scrubber followed by compression, drying, and distillation—must be sized for the plant’s peak CO₂ generation rate, which occurs around hour 12–18 of a batch fermentation or at the high-activity stages of a continuous cascade. Undersized scrubbers vent CO₂ that could have been sold, and that lost revenue is no different from losing ethanol down a drain.
Biogas from anaerobic digestion of thin stillage turns a wastewater treatment cost into a boiler fuel credit. A plant processing 1,000 tonnes of corn per day can generate 8–12 million BTU per hour of biogas, enough to supply 20–30% of the steam demand. When I calculate the net thermal efficiency of a distillery, the plants that integrate biogas into the steam system consistently show a 3–4 percentage point improvement in plant-wide energy balance, which flows directly into a better net energy ratio for the ethanol produced.
A fragmented plant—where one contractor supplies the grinding line, another the fermentation, and a third the distillation—nearly always underperforms its design yield during the first year of operation. The causes are not technical deficiencies in the equipment; they are integration gaps that no individual supplier has the incentive to bridge. When the hammer mill spec does not match the preferred particle size for the liquefaction enzyme supplier’s protocol, or the distillation column’s turndown ratio prevents the plant from maintaining stable tray hydraulics during a seasonal drop in corn supply, the conversion rate takes the hit.
Turnkey EPC delivery changes the accountability structure. The same engineering team that sized the cleaning line knows the starch accountability target, the jet cooker temperature profile, and the molecular sieve regeneration cycle. This single-point responsibility ensures that the process flowsheet is designed as one continuous mass and energy balance, not a collection of unit operations with boundary conditions that someone else is supposed to manage. I recommend that any project evaluating a corn ethanol plant ask potential partners for a “conversion rate guarantee” framed as bushel-to-gallons ethanol over a 12-month average—not a spot test—and confirm that the supporting documentation includes the raw material specification, the enzyme supplier’s validated dosing curves, and the energy cascade simulation.
The plants we have delivered under this model, from Harbin in Heilongjiang to international greenfield sites, consistently achieved their design conversion rate within the first six months of continuous operation, because the process integration was verified in the digital model before a single conveyor belt was installed.
For any program involving a new ethanol plant or a conversion rate improvement project, having the process integration reviewed by an engineering team that understands the full corn-to-product chain can identify yield opportunities that are invisible from a single-unit perspective. Send your project specifications and production targets to bjhn@agrifamgroup.com or call 010-8591 2286, and we can confirm whether the current flowsheet or the planned configuration is likely to deliver the conversion rate your financial model demands.
A well-operated dry-grind ethanol plant consistently achieves 2.75–2.85 gallons of anhydrous ethanol per bushel (56 lb) of No. 2 yellow corn. The lower end reflects plants running standard 30% solids fermentation without corn oil extraction; the upper end is attainable with high-solids (32–35%) fermentation, optimized enzyme dosing, and very tight starch accountability across the front-end cleaning and grinding steps. Theoretical stoichiometry yields about 2.95 gallons per bushel from a bushel containing 32 lb of starch, so the practical recovery efficiency is 93–97% of maximum.
Test weight, foreign material, and moisture content directly influence the starch available for fermentation. Low test weight corn (below 54 lb/bu) contains less endosperm per volume, so the plant processes fewer bushels to hit the same ethanol output, but the starch per unit weight is lower, reducing the per-bushel yield. Broken corn and foreign material (BCFM) above 4% effectively means that 4% of the material entering the plant is not starch-bearing and must be separated—if separation is incomplete, those fines increase viscosity without contributing fermentable substrate. The conversion rate can drop 1–2% for every 1% increase in non-starch foreign matter that reaches the mill.
The conversion rate is verified through a mass balance that starts with the corn weighbridge ticket and ends with the ethanol custody transfer meter, corrected for inventory changes in fermentors, beer wells, and storage tanks. Most plants calculate “bushels per gallon” daily, but the verified number for performance guarantees should be tracked on a 30-day rolling average to smooth out inventory timing errors. The supporting data includes starch content of incoming corn (analyzed weekly), starch in DDGS (weekly), and ethanol concentration in fermentors at drop, all traced back to a single month’s corn receipts. I always recommend dedicating a mass balance spreadsheet that links the corn lab data, the daily production log, and the monthly financial close, so the conversion rate is not an engineering estimate—it is a financially auditable number.
Not necessarily. A plant can push conversion rate to 2.82 gal/bu but operate with such high enzyme costs, excessive yeast propagation expense, and extended fermentation times that the incremental ethanol produced costs more than the incremental revenue it generates. The economic optimum is a function of corn price, ethanol price, enzyme cost curves, and natural gas cost for the extra distillation steam. Plants that manage the total cost per gallon usually find that a conversion rate in the 2.75–2.80 gal/bu range delivers the best net margin, unless the ethanol sales price justifies the marginal cost of the last 0.05 gallons. This is one decision where a process integration review pays for itself, because small changes in any unit operation ripple through the energy balance in ways that are difficult to see on a P&L statement. If your plant is evaluating this trade-off, share your current operating data and we can model the optimal operating point for your specific cost structure.
If you’re interested, check out these related articles:
Driving Global Food Conservation Through Technological Innovation







bjhn@agrifamgroup.com